Better ways to measure human-curated dataset quality
- Technology

When leaders set out to improve business process efficiency or decision quality in an organisation, they often target improving data quality as a means. Often human-curated datasets are at the crux of the matter – such as company asset ownership databases, sales or recruitment databases or even employee time tracking data.
Leaders may want to drive staff toward behaviour that improves and maintains data quality. One way is to push for behavioural change to curate the data better and measure this privately with a metric. Another is to socialise the metric, tie it to performance and let behavioural incentives do the rest.
Finding the right metric to drive behaviour improvements in human curation of data sets is hard. If you pick metrics based on availability, ease of calculation, or simplicity of definition, you may end up with dysfunction. You need suitable metrics to drive behaviour, even when they are hard to define. Human-curated data isn’t obviously cross-checkable… surely only the human that entered a data field knows if it is correct? This guide sets out a way to build good metrics around human-curated data.
Hell is other people’s bad data
Let’s look deeper at the efficiency cost of poor data quality. Bad data leads to bad decisions, or at best instinctive gut-feel decisions – these may go awry and need to be unwound. This costs an organisation money and pace, and risks falling behind the competition. Bad data can also lead to thousands of hours of lost productivity while staff chase up inaccuracies, contact the wrong party seeking information, or pursue their own local and ad-hoc curation approaches.
But driving behaviour to actively curate a central shared dataset is hard. Some staff see and value the big picture, and diligently engage; others do not and the dataset becomes a patchwork, with quality & coverage issues. A sustained solid level of engagement can tail off when management focus alters, and the data soon turns stale. Once a user encounters coverage or accuracy problems in the dataset, they may lose trust, and become less willing to contribute, further accelerating the dataset’s decline. Re-establishing broken trust is next to impossible.
Therefore we need quality control. And quality control needs a control feedback loop.
An authoritarian approach is to measure staff activity and link it to performance or competence. Formal attestation. Three strikes and you’re out for neglecting your duty. Those who go this route have to walk a tightrope as this pressure makes people subconsciously (or deliberately) probe for optimisations which satisfy the letter of the metric rather than the spirit of it. An alternative, soft approach is cultural outreach to promote “being a good citizen”. Incentive alignment helps – when the contributors directly feel benefit from the accuracy of the dataset, but even then, the curation task can feel overwhelming… and hopelessness leads to apathy… “we tried fixing that, we just can’t do it.”
No matter what your approach, you need the control feedback loop closed, and for this you need a suitable metric that actually drives the behaviour you want. More often than not it’s better not to think so much about the abstract data set but think more about people – the people whose behaviour you are aiming to influence. We aim to show you how to improve your measurement of human-curated data quality, making metrics which are more holistic and less likely to drive staff toward unhelpful/unintended behaviour. We also want an approach which uses human attention efficiently – not wasting staff effort continually re-checking data.
Three steps to better metrics
Don’t make the mistake of being too pessimistic about your ability to measure data quality in human-sourced data. Yes, a single snapshot of a dataset sourced from humans cannot be validated by a computer algorithm. There’s no way the algorithm can tell that Tina’s team owns the Office 365 relationship, or that Joe picked up a good sales lead at a conference last week about flogging SuperProduct9000 to BusyWorkCorp. But the internet advertising industry has learned that if you model and measure human behaviour you can achieve massive amounts of insight and understanding – which has in turn led them to big profits.
If you take some simple steps forward in your approach, you can make computerised measurement tractable. The key tricks are:
- Make detailed measurement of human behaviour using dataset curation tools, and use this as a proxy for dataset quality. Ensure the dataset captures full edit history and context and make these events accessible for analysis.
- When there is no clear simple metric, or when you fear a clear simple metric could drive the wrong type of behaviour, don’t bet on a single horse – adopt a range of measurement approaches and use the maths we detail below to combine them safely. You could even adopt competing approaches or variations on the same approach if you’re not sure what’s better.
- Apply simple models of human behaviour. Understand that humans build habitual behaviour through repeated learning sessions with time gaps in between, and that you can categorise the level of human engagement curating a dataset. For example you can tell whether a user is doing one-off/prompted or habitual interaction by looking at a timestamped sequence of their editing events.
Holistic Engagement Metrics
A holistic engagement metric measures all of the many different ways people use a dataset curation tool. Good use of tools implies good data quality. Let’s look at two template approaches.
Time cost & burden comparison
Suppose we measure the human time spent working with the dataset. We can compare this against a anticipated/required level of engagement in FTE (person hours spent curating per month simplifies just to number of people). We take the number of objects and the number of data fields and multiply by the time expected to review/edit a field. This is the amount of engagement time your curation platform needs per review cycle. You could choose to do this by individual human or by job role.
You can measure actual time engagement in web applications using javascript. With the right code, you can distinguish between active interaction with a site versus having a tab open in the background. If interaction is not through a web app, performing a transaction such as posting an edit on the command line or running a query could be assigned an approximate number of minutes of engagement e.g. 1 min to post an edit, 1 min per narrow search query, 5 mins per wide query.
Points mean prizes
Thinking in terms of “points” is an alternative to thinking in time, and is a good way to be organised about how you combine metrics without getting too maths-heavy. Let’s look at an example.
The author worked on a system for managing resource ownership. You used the tool day to day to agree who owns which git repo or fileshare, and pass on ownership as people change jobs or leave. The core task was making an ownership assertion, which produced a timestamped event. People did these as one-offs or in batches of hundreds, and there was a wide variety of engagement. This stream of assertion events was the main thing used to calculate engagement points.
Users got engagement points for making assignments, and for the amount of use of six different GUI features, such as “adding free text comments when making an assignment”, or “assigning ownership to an app rather than a person”. The scoring was as follows:
| Metric | Value | Points |
| Total # of assertions | 0-100 | 4 pts |
| Total # dates with assertions | 0-75 | 4 pts |
| Total # assertions in last 3 mon | 0-5 | 2 pts |
| Feature: has assigned to self? | 0-2 | 2 pts |
| Feature: has made dual control assignment? | 0-2 | 2pts |
| Feature: has classified own asset? | 0-2 | 2pts |
| Feature: has made assertion with comment? | 0-2 | 2pts |
| Feature: has assigned asset to an app? | 0-2 | 2pts |
| Feature: has classified with extended axis? | 0-2 | 2pts |
| Total | 22 pts |
As shown by the value and points columns, the actual number of assertions are converted into points by scaling the data to a range e.g. 100 total assertions = 4pts.
Where two different metrics measure essentially exactly the same thing and you want both (or can’t decide which is better), you should think of the desired proportion of score to attribute to a single hypothetical metric, and split it across the two. You can see this happening with the first three rows which are all variations on assertion counting in the points scheme above, taking up 10 points overall.
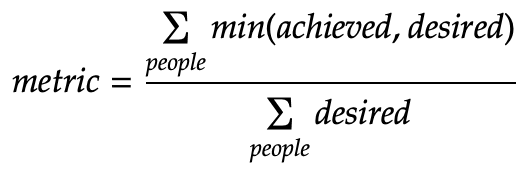
Achieved versus Desired
Often you want to roll up everything into a single metric ranging from 0–1, as popularised in Objective & Key Result (OKR) frameworks. You can combine engagement metrics per user just by adding them, or an average can be taken over the potential user base. Even better is to compare engagement with a desired engagement metric. Here’s an example for resource ownership curation:
| Desired Engagement | Value | Points |
| Total # resources owned | 0-500 | 6 pts |
| Total times proposed as owner | 0-500 | 6 pts |
| Seniority in organisation | Div Leader=6 Mgr=3 else 1 |
6 pts |
If you do this, you can pick out over and under engaged people. To roll everything up into a single metric, you could limit the achieved user engagement to be the minimum of the desired and achieved, then sum these across everyone, and divide by the total desired engagement, as follows:
You might want to aggregate up engagement points by job role or team first before calculating the statistics. It depends if you care that the right person is doing the curation, or you just want a certain number of fully engaged people on the job.
The better your desired engagement metric is at understanding and communicating the expected level of involvement from a given person, the less clever the code to combine per-user engagement metrics needs to be.
In the author’s case, we specifically wanted resource owners to do the work, and felt that good samaritans engaging on their behalves (while good for boot-strapping) was not incentive aligned, and probably unsustainable long-term.
Choosing & designing individual metrics
When building a holistic metric you need to choose the individual building blocks. Here are a bunch of ideas for building blocks the author arrived at from making multiple iterations at the design of various engagement metrics:
- Curating optional fields shows positive engagement, which goes hand-in-hand with attention to mandatory fields. So you can use a high fill-out rate to up-score accuracy of a record. This works across a wide variety of datasets.
- Use of advanced features, or a very broad use of features indicates a user is highly familiar and engaged, even if the tool is not used very often.
- Try to keep hold of and process event history of all the edits that make up the data, rather than just the current values of the data, or periodic snapshots. This gives you the most to work with. If you hold a dataset in Git, you can examine full change history, and with GitHub even full “pull request” review/decision discussions to analyse.
- Linkage information in CMDBs or other inventory management systems, can help you spot stale data by understanding what objects are “orphaned” as they are unlinked to the rest. These will likely be inaccurate.
- Making an edit to one field implies adjacent fields are accurate, since a good citizen user would fix them up if they were not at the same time. You need to understand the UI design of a curation the tool, and believe editors will hold enough information in their heads to be likely to correct stuff on-the-fly.
- If frequency of editing of a field drops away, you may be able to distinguish using the data between lack of edits because the data is accurate, and lack of edits because users are becoming disengaged. The former would look like a sawtooth of exponential decay in editing rate, whereas the latter would follow a normal distribution as people gradually get distracted.
- If you have an engagement metric for people, but you want something data-centric, and if people own specific objects or object types, then you can combine and convert the holistic engagement metric into a metric per object/object type.
When you’re doing the maths to calculate a metric, the following tips are useful to get more signal out, and to make measures which aren’t as easily gamed.
- Prefer measuring task completion sessions over counting individual task completions in a GUI. There is more on the “why” of this in the section on modelling human behaviour. Using a tool to curate a dataset half an hour per day is probably much better than a 4 hour session twice per year. Just aggregate the events using timestamps to the nearest 1hr. Or to the nearest day if you prefer.
- Always limit a metric (set min/max bounds) and normalise it (scale it to a range) before combining with another. For example, combining number of visits to a UI and number of records modified, scale each number to a range e.g. 0–1 and then add.
- If you are looking at capability rather than effort, the first few actions taken by a person are much more important than the total number they perform, because it shows that capability. You can take the logarithm of the number of tasks if you want so that there will be some increased engagement score for completing 1000 tasks versus 100, but no where near as impactful as completing the first 10 ever.
- You don’t need to be all-or-nothing about accuracy. If you have an attestation process where object owners sign-off that data is accurate, rather than marking it inaccurate the first day it gets older than (say) 30 days without attestation, use a drop-off model. You could use an exponential, sigmoid or logarithmic model if you want.
Pitfalls & Gotchas
Here are some problems to watch out for:
- Try to minimise the amount that your metric depends on specifics of the data model. For instance don’t take the average data age of “three metadata fields – description, cost and status”, instead take the average age of “all optional metadata fields”.
- Assuming engagement in curation tools leads to good quality data is just an assumption… you might want to check it out. If a curation tool is not fit-for-purpose a proper amount of time spent may not be enough.
- Check that the people who are curating the data will actually benefit from it being accurate, i.e. “incentive alignment”. Without that, even once engagement has become habitual it will likely tail off as more important tasks compete for attention.
- Attestation processes are imperfect – even a conscientious user may miss something while they are reviewing the data, just like code review. We recommend viewing attestation as something that reduces a “data age” metric or improves a “data accuracy” metric, rather than a black-and-white “done or not done” check. You usually want people to be continually curating data and working on accuracy and not set an expectation they will only do it on some occasional schedule.
Toward modelling human behaviour
The approach and tips above all build on assumptions about human behaviour patterns. If you want to take it to the next level, you can adapt your approach by adopting a model of human engagement with three stages:
Discovery – the person is finding out about the tool/data/feature for the first time. Look at the timing of an event in relation to the first ever event to find discovery behaviour.
Prompted Interaction – the person is responding to encouragement/nagging from the tool to get involved. Adapt the tool to include referral URLs in nag emails and create events which can be tracked.
Habitual Interaction – look for lots of repeated sessions of use. The key being the number of sessions rather than the session length or amount of tasks completed in the session.
You can use the heuristics above to bucket behaviour into these three categories and then award more points for the behaviour type you desire (that presumably leads to the best data quality).
The most advanced possible approach would be to classify events using a model of human training which tolerates exponential backoff in frequency of performing the task while still keeping it well remembered. That is, because of the way long-term memory works, if someone initially performs an event frequently they can still be considered adept if they use it infrequently, so long as the initial usage pattern is enough to commit it to long term memory, and they are reminded at some minimum frequency. Foreign language vocabulary memorisation tools use learning models like these to great effect.
Why we don’t just count stuff
Usually there are a few core tasks underlying a user interface (e.g. for an email client the core tasks would be “reading an email” and “writing an email”). One can just taking the counting approach – total the number of times the task has been performed by a user to make a metric, but it’s not the best way.
It is better to use weighting. If you are looking at recently performed tasks, instead of counting the number of emails written in last 3 months, you can count them all, but weight them by recency (email written=1pt, email in last year=2pts, email in last month=5pts).
When we want to measure progress toward habitual behaviour, using a logarithm on the simple “number of emails written” metric can be a good low-complexity approximation and alternative to weighting or building a full model. The author used the following equation:
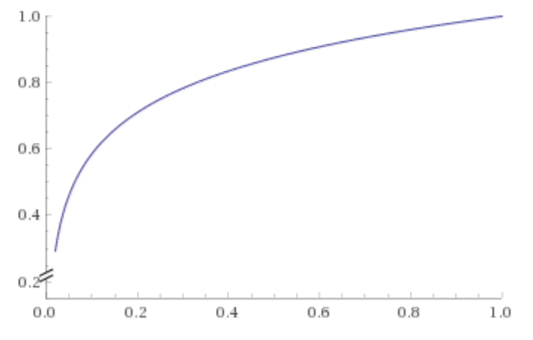
This is the base 2 logarithm of a metric ranging 0–1, divided by 8. Mapping the number of emails written onto the X axis, one can see that increasing number of emails written contribute less to engagement than the first one, or indeed the first couple.
For modelling habit forming, all of the above are imperfect. The way human memory works the number of repetitions of an event within a single learning session is rarely relevant. People learning a musical instrument can play through the same piece many times over but only make progress upon taking a break, then coming back to it. So the number of sessions containing performance of a task is the better lens, because it speaks to habit forming over time, which a one-off big burst of task completion doesn’t do.
You can still do weighting or logarithms on session counts if you like.
If you don’t have the data to understand and distinguish between specific interaction sessions on a curation tool, then taking the number of unique days on which a person has performed a task is a good approximation (sleeping overnight beds in habits).
Further reading
If you’re interested in reading more about relating human behaviour to dataset quality, here are some areas you can take a look at:
For looking at measuring human interaction with GUIs, the Google HEART framework is worth a look. Its letters stand for major axes of behaviour to measure: Happiness, Engagement, Adoption, Retention & Task Success.
You could look at work done on measuring and controlling the accuracy of humans performing tasks on micro-jobbing platforms like the Amazon “Mechanical Turk”, and there is research into spotting fraud and negligence in form-filling in customer to business/government interactions, such as in insurance claim fraud.
It’s also worth noting that machine algorithms as well as humans are prone to dysfunction in behaviour due to gaming the reward function. An interesting specific example is image classifiers discovering side-channels, and there is a list of examples in this blog post.
For work on the challenges of using metrics to drive human behaviour in organisations, there is Measuring and Managing Performance in Organisations – by Robert D. Austin.
Conclusion
This guide aims to show you that there’s a wide playing-field of metric approaches out there.
Remember that human behaviour can be measured by computers. The online advertising industry has done it: here every click, page view, mouse movement even is feeding into models to understand whether the advert has your attention and predict your actions. The power to understand and predict human behaviour is there if you need it, and therefore it can be applied to quality control for human-curated data just as it can be for almost any human activity.
You can go a very short way… or as far as you like on this journey. You can range from taking the very most basic metric such as “number of unique users of a curation tool per week” or “number of objects in dataset updated in last 6 months” through to advanced data science.
Remember the three steps:
- Measure human behaviour using dataset curation tools
- Pick plenty of approaches and combine them when there’s no clear winner
- Apply simple models of human behaviour in habit forming
With a little bit of know-how you can adopt these simple improvements to counting based metrics and you can get better combinatorial properties and deal with uncertainty in the validity of the measurement approach… all without having to put a fully paid up data scientist on the payroll, pointed at the data. Best of luck!
Mike Bond – Principal Architect