OpenTSDB Meta Cache – trade-offs for performance
- Technology

Data is at the core of everything we do at G-Research, and metrics are no different. We’ve been running a reasonably sized OpenTSDB installation for 4 years now, and are putting metrics from applications, systems and processes in it at a fair rate (currently about 11 billion points a day). We’ve scaled our cluster over time and added cross site clusters for data resilience. We now write points to all clusters.
Scaling OpenTSDB (and HBase) is a fine art, but a couple of basic configuration options can have a massive impact on performance:
- tsd.storage.enable_appends – Whether or not to append data to columns when writing data points instead of creating new columns for each value. Avoids the need for compactions after each hour but can use more resources on HBase.
- tsd.core.meta.enable_tsuid_tracking – Whether or not to enable tracking of TSUIDs by storing a 1 with the current timestamp every time a data point is recorded.
- tsd.core.meta.enable_tsuid_incrementing – Whether or not to enable tracking of TSUIDs by incrementing a counter every time a data point is recorded. (Overrides tsd.core.meta.enable_tsuid_tracking).
In this article we’re going to show the impact of setting the latter 2 options, and a new plugin we’ve written that allows you to retain most of the benefits of tsuid tracking with almost none of the performance cost.
Test configuration
You can see the impact of these last two options in the following graphs. For our tests we’re running an OpenTSDB cluster in AWS EMR comprising 1 master and 3 core nodes running on r5.4xlarge instances. For load we’re running 500 c4.large instances with tcollector, and simple load generating script with some parameters that allow us to tune the shape and volume of the load, as well as outputting some metrics on what it’s up to:
#!/bin/bash

METRICS=10
SLEEP=2
TAGKS=2
TAGVS=2

RATE=`echo "scale=2; ($METRICS*$TAGKS*$TAGVS)/$SLEEP" | bc`

function tag_combinations() {
  NUM=$1
  if [[ $NUM -eq 1 ]]; then
    for v in $(seq 1 $TAGVS); do
      echo ",tagk1=tagv$v"
    done
  else
    NUM_MINUS=`echo "$NUM-1" | bc`
    for b in `tag_combinations $NUM_MINUS`; do
      for v in $(seq 1 $TAGVS); do
        echo "$b,tagk$NUM=tagv$v"
      done
    done
  fi
}

while (true); do
 NOW=`date +%s`
 echo "loadtest.metrics $NOW $METRICS"
 echo "loadtest.sleep $NOW $SLEEP"
 echo "loadtest.tagks $NOW $TAGKS"
 echo "loadtest.tagvs $NOW $TAGVS"
 echo "loadtest.rate $NOW $RATE"
 for m in $(seq 1 $METRICS); do
  for tc in `tag_combinations $TAGKS`; do
    TAGS=`echo $tc | sed -e 's/,/ /g'`
    echo "load.metric.$m $NOW $NOW$TAGS"
  done
 done
 sleep $SLEEP
done
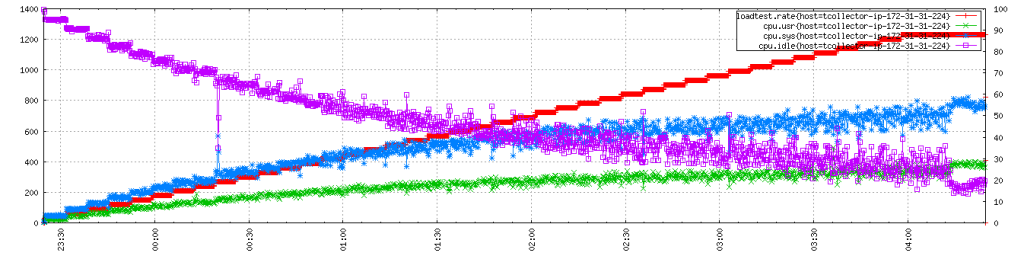
A typical load generating node looks like this as the test progresses:
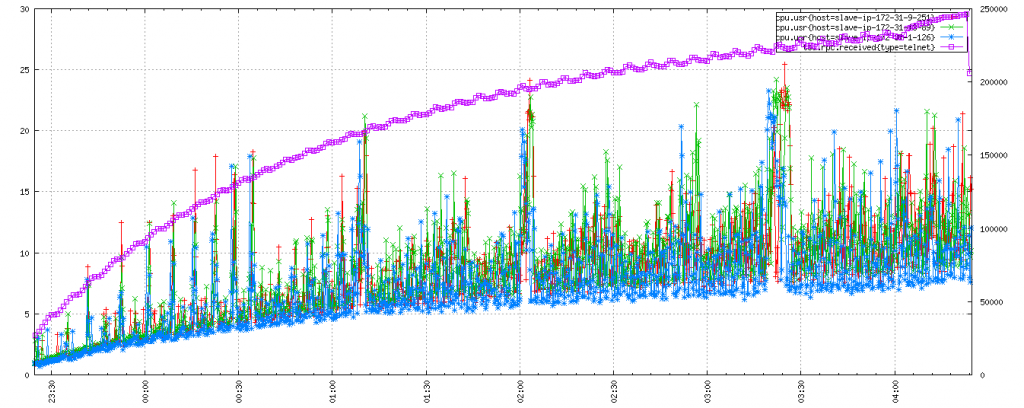
Baseline
In the first graph we see the impact of load on our OpenTSDB cluster. The initial cluster has neither tsd.core.meta.enable_tsuid_tracking nor tsd.core.meta.enable_tsuid_incrementing enabled:
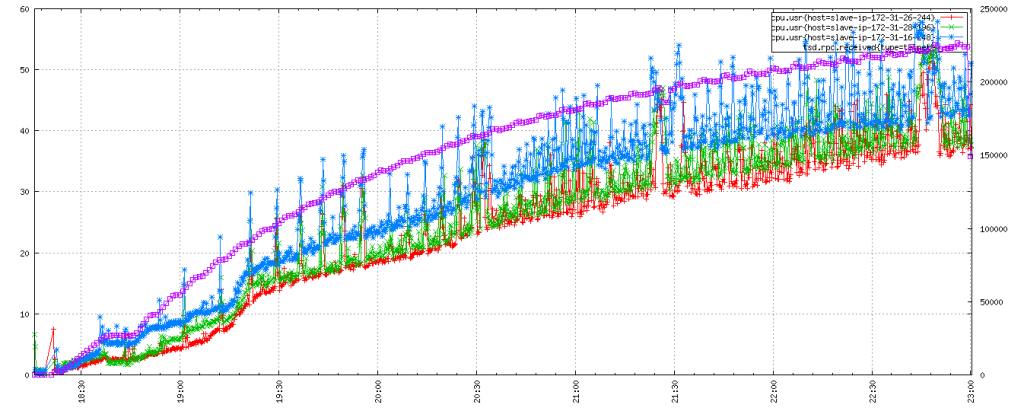
Tsuid tracking
In this next run we enabled tsd.core.meta.enable_tsuid_tracking:
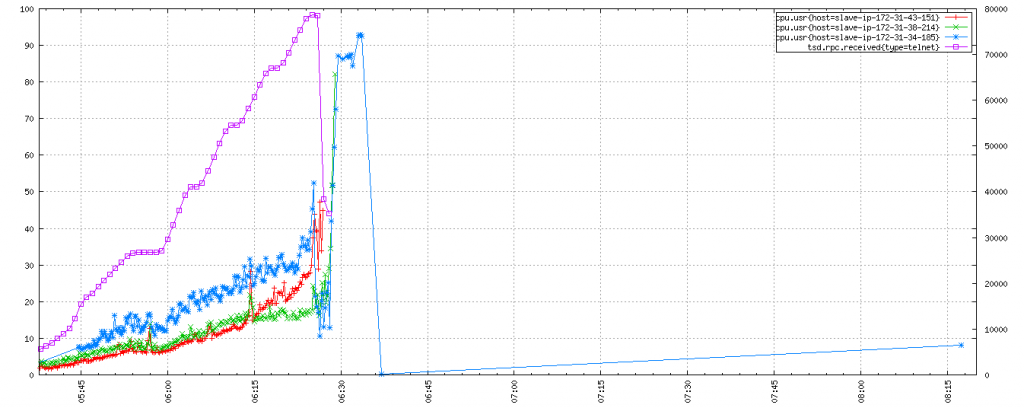
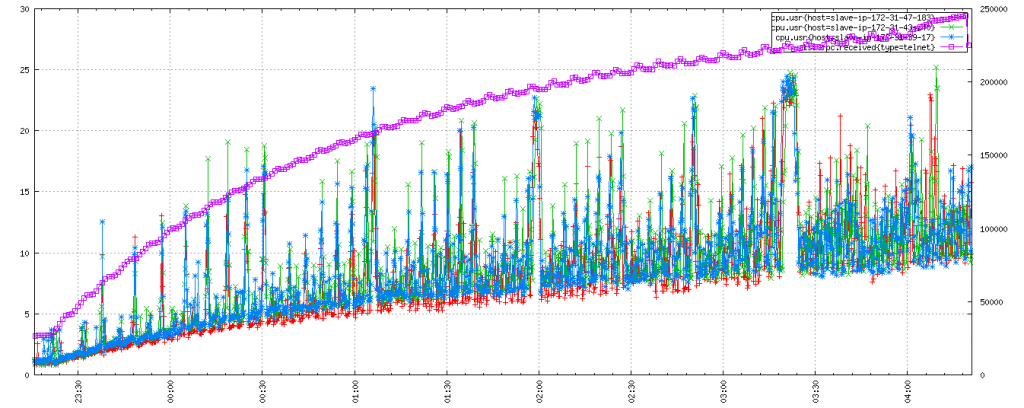
Tsuid incrementing
Finally we see the impact of enabling tsd.core.meta.enable_tsuid_incrementing as well. This is a catastrophe (and more importantly a repeatable catastrophe), 2 of the OpenTSDB instances crash an hour into the test with errors around locating tsdb-meta regions.
Benefits of tsuid tracking
Before we get into the details of how we can reduce the cost of tsuid tracking, it’s worthwhile understanding the value we get from enabling it.
From the OpenTSDB documentation we can see what data gets stored on a TSMeta object:
“Each timeseries in OpenTSDB is uniquely identified by the combination of it’s metric UID and tag name/value UIDs, creating a TSUID as per UIDs and TSUIDs. When a new timeseries is received, a TSMeta object can be recorded in the tsdb-uid table in a row identified by the TSUID. The meta object includes some immutable fields such as the tsuid, metric, tags, lastReceived and created timestamp that reflects the time when the TSMeta was first received. Additionally some fields can be edited such as a description, notes and others.”
The real time creation of TSMeta objects is enabled by setting tsd.core.meta.enable_realtime_ts along with tsd.core.meta.enable_tsuid_tracking or tsd.core.meta.enable_tsuid_incrementing. Incrementing requires that tracking is also enabled.
Enabling tracking gives us an automatically updated value for lastReceived whenever a new data point is written. Enabling incrementing gives us an accurate count of the total number of data points written from the point of enabling onwards.
So why is this data useful?
When you’re running a large estate, then timeseries come and go in their usefulness, but because OpenTSDB is designed with the premise that storage is cheap, thus we should store forever, the data remains, and over time you build up useless cruft that relates to old servers or systems long since decommissioned. This data:
- Unnecessarily uses up disk space – it can likely be rolled up and then deleted
- Clogs suggestion lists with values which are no longer relevant
And how are you to identify this? Well, with metadata which tells you when we last wrote a timeseries. We might then reasonably consider for deletion all timeseries which have had no writes in the past year.
There is another, more immediate use for lastReceived values – identifying timeseries which should be writing but which have stopped. This might indicate a bug in a collector, or even a host out of action.
Tuning tsuid tracking
So, we can see that both tsuid tracking and tsuid incrementing are costly, and whilst the data from tsuid incrementing would be nice to have, that from tsuid tracking is most useful.
To see whether we can do anything about the cost of tsuid tracking, first we have to look a bit deeper at what it’s doing and what we can do to improve performance.
When you write a data point into OpenTSDB it is written into the tsdb table in HBase with the row key composed from the tsuid and the start of the hour of the timestamp, the column name from the offset from the hour, and the value as the data.
When you have tsd.core.meta.enable_realtime_ts enabled, then a row will also be created in the tsdb-meta table (if it doesn’t exist), with the tsuid as the row key, name:ts_meta as the column, and a JSON object representing the TSMeta object as the value.
When you additionally have tsd.core.meta.enable_tsuid_tracking enabled, then for every write of a data point, a value of 1 is written to the tsdb-meta row for the tsuid with name:ts_ctr as the column, which will implicitly contain the timestamp of the write. And this is where the performance hit comes – for every data point you write, you now have two writes to HBase.
If you go one step further and enable tsd.core.meta.enable_tsuid_incrementing, then for every write of a data point, the value of the name:ts_ctr column is atomically incremented, which is a more expensive HBase operation than the aforementioned write.
What can we do to ameliorate the cost of the extra HBase put when we have tracking enabled?
If you consider two of the possible use cases for the lastReceived value, they don’t require timestamps to be perfectly accurate. If you’re considering whether data has been written in the last year, then you’re probably not fussed about an hour or a day either way. So, if you were to allow only one write per hour for a timeseries which writes every 15s (the tcollector default) then you could go from 240 writes to the tsdb-meta table in an hour to 1 – a saving of 99.6%!
This logic could be trivially implemented using an LRU cache, at which point you have a couple of settings that will affect operation:
- Entry TTL – effectively the amount of time between writes for a timeseries, allowing you to trade accuracy for performance
- Cache size – the number of timeseries the logic can track, allowing you to trade memory against performance.
opentsdb-tsuid-ratelimiter
So finally, we introduce our new plugin for OpenTSDB, opentsdb-tsuid-ratelimiter, which implements the logic described above, using the meta cache plugin capability added in OpenTSDB 2.3.0.
The plugin gives you a couple of settings that allow you to tune its performance, and trade the accuracy of tsuid data against the performance hit of cache entry expiry:
- tsd.meta.cache.max_size
- tsd.meta.cache.ttl_seconds
To get the maximum benefit, it’s recommended to set the cache size to the maximum number of unique timeseries you expect to see within the TTL period, assuming you have sufficient spare memory (memory cost should be no more than 20 bytes per time series).
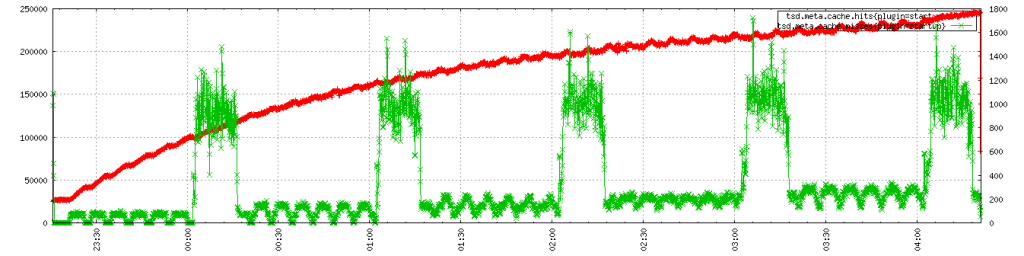
As you can see, this has comparable performance to the baseline in our test:
And you can see the cache being well exercised with an increase in miss rate on a 1 hour cycle (in keeping with a 1 hour TTL):
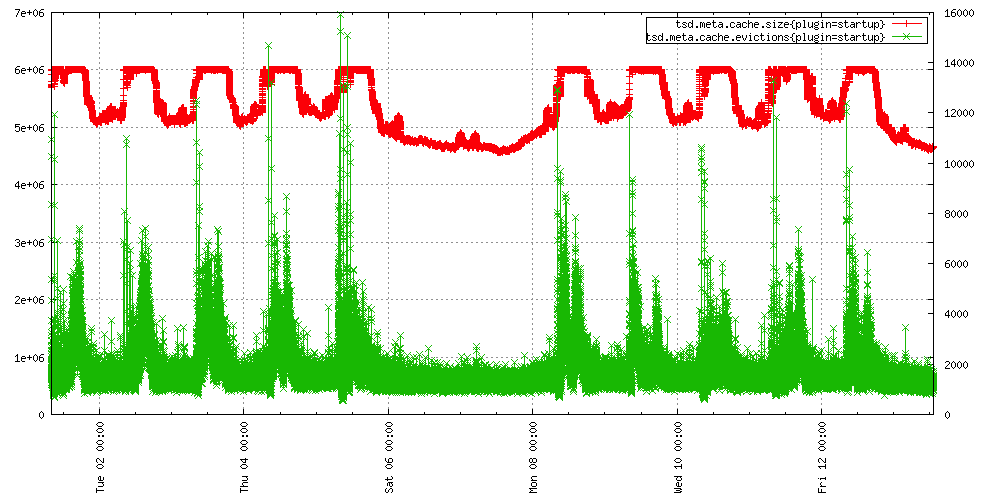
As usage of your cluster changes you will need to update the maximum size of your cache, otherwise you’ll see a higher volume of evictions during peak period, as demonstrated by this graph from our production cluster:
Performance table
As a final point, we’ve collated the peak performance for each of our tests runs into a handy table, so you can see at a glance the cost of the various configuration options, plus that of a well configured plugin.
| Configuration | Peak ktps | CPU at peak | Notes |
| Baseline | 250ktps | 9% | |
| Tracking | 225ktps | 40% | |
| Tracking with plugin | 250ktps | 10% | |
| Incrementing | 80ktps | 90% | 2 TSDs crash after 1hr |
Simon Matić Langford – Site Reliability Engineer